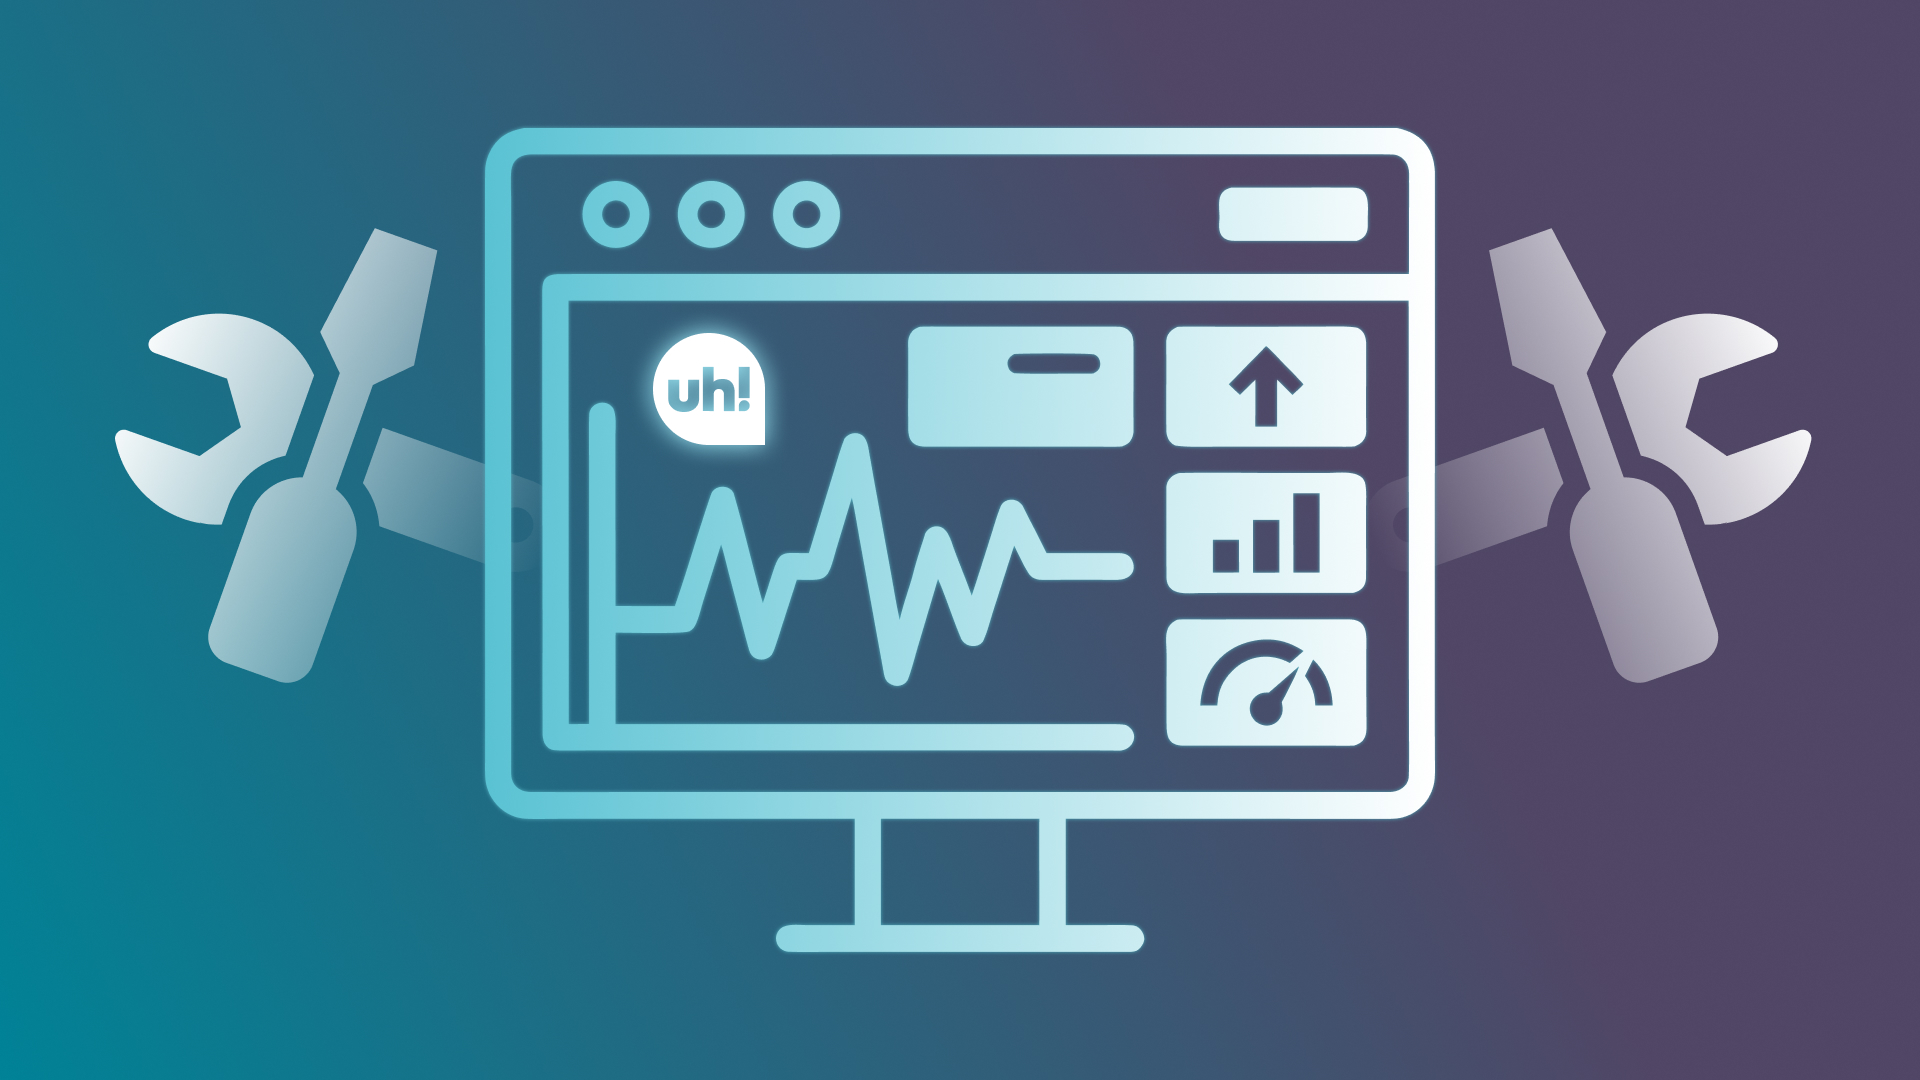

Here, we will discuss the monitoring tools used by uh!live to oversee these services.
Monitoring tools not only allow us to stay informed about the infrastructure’s performance and status but also to improve the services we provide to our customers, for example, by adjusting thresholds based on their activity and taking a more proactive approach when necessary.
Monitoring encompasses several distinct categories: monitoring and data collection. Strictly speaking, there is no single tool that can do everything. It is the combination of several tools that makes the whole system effective.
Here is a non-exhaustive list of the tools used within uh!live :
Icinga2
Icinga2 is the primary monitoring tool, regularly checking the status of servers and services. It sends alerts in the event of a problem.
Combined with the Icingaweb2 web interface, it is a solid choice for monitoring heterogeneous server farms, whether they consist of physical servers or virtual machines.
Based on Nagios, it allows us to create our own monitoring scripts (Bash/Python), set up separate geographic zones using the satellite configuration, deploy the web interface in other geographic regions, and customize every aspect of the configuration (timeouts, email/SMS/internal communication tool alerts).
Prometheus
Prometheus collects and stores real-time metrics from our applications and servers. It regularly polls endpoints exposed by our services, then allows us to query them using its own language, called PromQL.
Combined with Grafana, we can create multiple custom dashboards based on the needs identified by our internal teams.
Prometheus Agents
We rely on several locally installed agents to collect all the metrics we need:
- Node Exporter exposes system metrics (CPU, memory, disk, and network).
- MySQL Exporter exposes metrics related to MySQL/MariaDB databases,
- PostgreSQL Exporter exposes metrics related to PostgreSQL databases.
The metrics are exposed in a format that only Prometheus can read. The agents are simple, lightweight, and unobtrusive, without consuming too many resources on the servers.
Smokeping
Smokeping is a tool that continuously monitors network latency and packet loss to defined targets. Results are displayed in graph form, reminiscent of the Cacti tool for those feeling nostalgic.
It is very useful when you have an IT architecture deployed across multiple sites and geographic data centers, as well as extensive network segmentation, as is the case within uh!live.
Graylog
Graylog is a SIEM-type tool that centralizes all logs generated by our servers and applications in a single location. The basic interface makes it easy to search, filter, and create alerts based on these logs.
It can also be managed in a cluster to handle a significant volume of data. You can retain data for a defined period of time in accordance with security policies or investigate an incident that has occurred. The ability to create alerts using multiple connectors is an added bonus of the tool.
Using a tool like Graylog is essential in our architecture because it provides real-time information and alerts, which is at the heart of the uh!live’s business.
Other Tools
In this article, we discuss only the main tools used in infrastructure management. We do not cover the tools used in application development, which are just as numerous and valuable.
We have also developed custom tools that are primarily used in very specific ways for certain scenarios.
All scripts and configurations are stored and versioned on GitHub, deployed using Ansible and Puppet. Although these tools are not specifically for monitoring, they assist us daily in managing the infrastructure.
It’s not just about the tools…
Alert Management
To avoid being overwhelmed by the number of alerts, we conduct a regular review of alerts to determine their relevance and status. A sort of “spring cleaning,” if you will.
Documentation
In a complex system involving multiple disciplines, it’s essential to maintain up-to-date documentation that outlines the proper response to an incident and to have reference guides on the tools and historical data to track incident frequencies, etc.
The Human Aspect
Once all these tools are in place, we must not overlook the human aspect, which is essential to the effective monitoring of the infrastructure:
- Implementing a regular review of past incidents,
- Developing clear documentation,
- Identifying recurring patterns and alerting the appropriate people to improve tools and processes,
- Conducting regular IT monitoring,
- Team cohesion is essential, along with optimal information sharing.
Resources
- Icinga2: https://icinga.com/
- Icingaweb2: https://github.com/icinga/icingaweb2
- Prometheus: https://prometheus.io/
- Node Exporter: https://github.com/prometheus/node_exporter
- MySQL Exporter: https://github.com/prometheus/mysqld_exporter
- PostgreSQL Exporter: https://grafana.com/oss/prometheus/exporters/postgres-exporter/
- Smokeping: https://oss.oetiker.ch/smokeping/
- Graylog: https://graylog.org