Behind the tech
Monitoring Tools: How uh!ive Supervises Its Infrastructure
Here, we will discuss the monitoring tools used by uh!ive to oversee these services. Monitoring tools not only allow us to stay informed about…
July 23, 2026
Behind the techProduct

uh!ive provides a comprehensive suite of services for processing and analyzing voice (speech analytics, speech-to-text), along with a web application to access this data. The core features are organized into pages: a conversation analysis page with dashboards and a page displaying the list of conversations and their details, including the redacted transcript.
Our customers use it to search, filter, and review recorded calls (transcripts, tags, and metrics). To give a sense of scale, some customers manage millions of calls.
Last year, the application's performance was declining, with loading times reaching 6 or even 8 seconds. Users shared their frustration through comments like: "It's a bit slow.", "It's lagging." That was a powerful motivator to dedicate a full development cycle to performance improvement. We experimented with a data-driven approach to identify problems and validate our progress through results.
We collect usage data from two primary sources: New Relic for frontend/backend metrics (including Core Web Vitals) and Amplitude for product analytics.
The data revealed a harsh reality:
We also looked at user environments. The vast majority (80%) use a desktop or laptop with recent Chrome-based browsers, on Windows. But we had no visibility into their actual hardware capabilities (CPU/RAM).
We therefore relied on indirect signals. 25% of sessions occurred on screens below 1366px, which is typical of older enterprise laptops designed for standard office work. This matters because the work demanded by a web application (scripting, layout, rendering) performs poorly on such devices.
We first focused our efforts on the Call List.
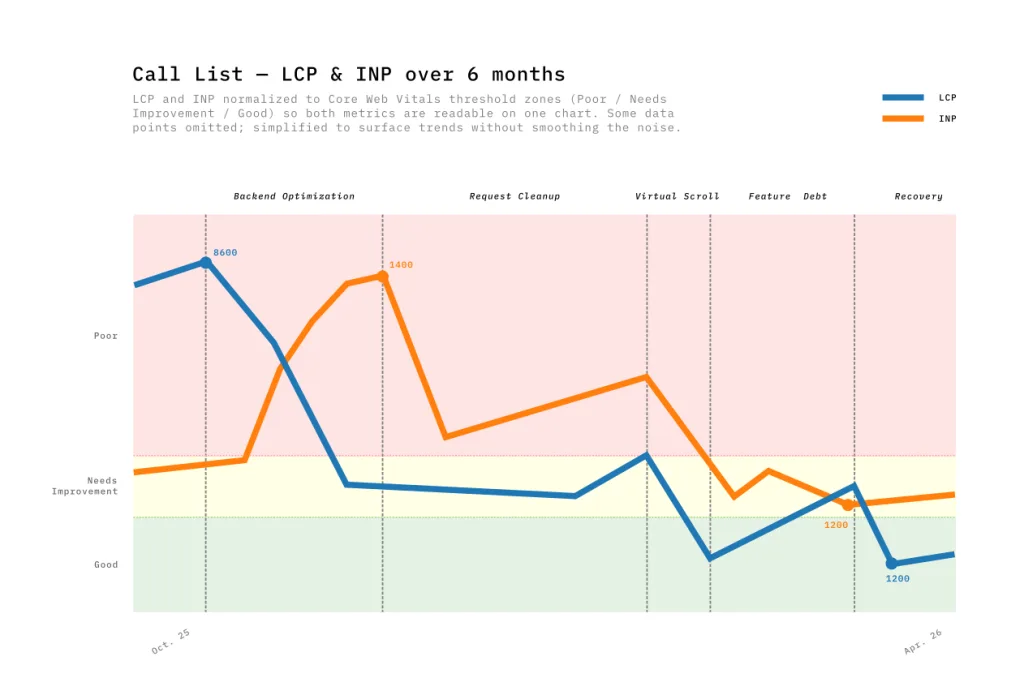 Over six months, we moved through five distinct phases of optimization:
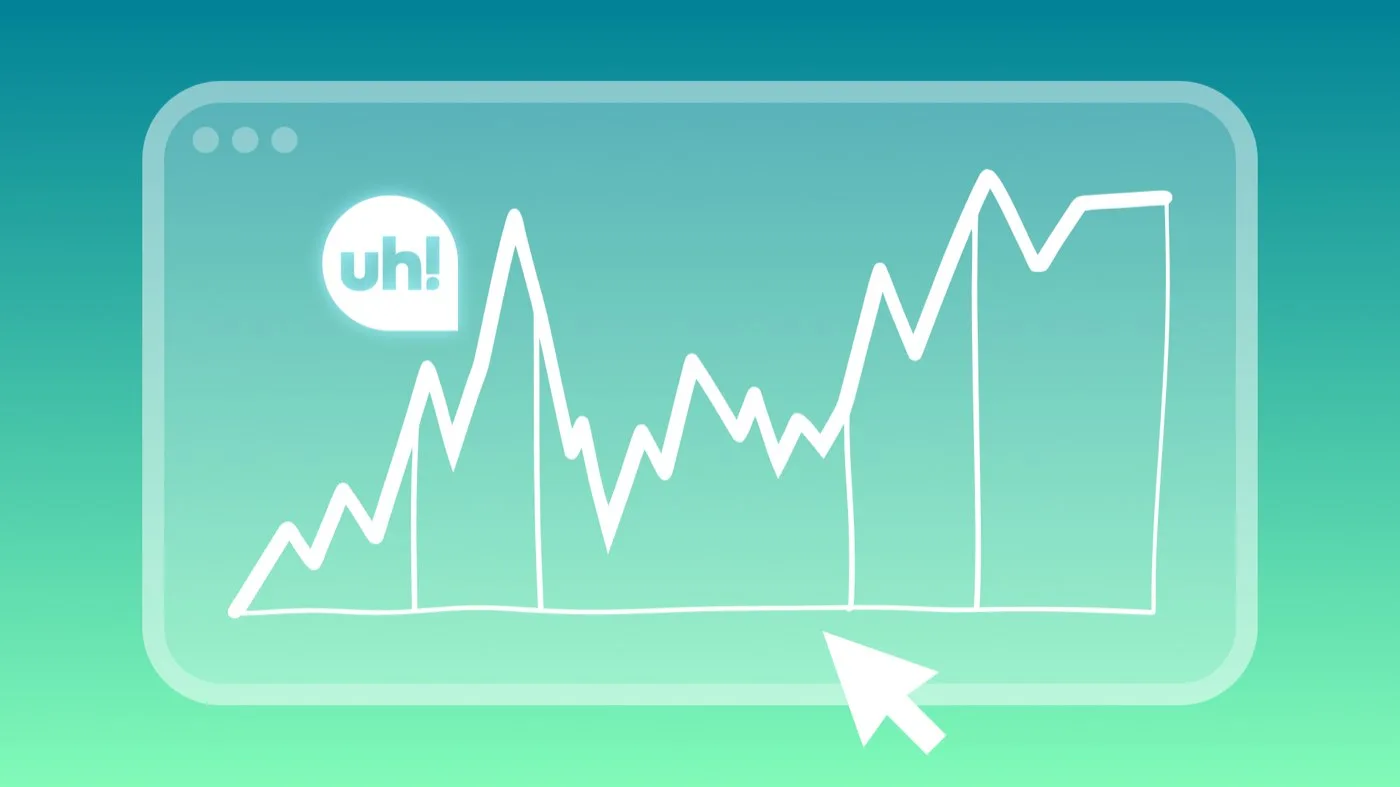
It would be tempting to draw a straight line from 8s to ~1.5s. But as you can see on the chart, the reality was far more capricious, more of a roller coaster.
One lesson from this experience is that performance is managed like a budget. Each new feature shipped consumes, often without us realizing, the speed gains previously acquired. Performance optimizations don't happen in a vacuum; product development continues in parallel.
During the first phase, when the backend team optimized API calls, the Call List LCP dropped from 8600ms to 4000ms! But something unexpected happened: INP spiked from 420ms to 1360ms in the same time. It took me a few months to understand why, while preparing the data for this post… The page loaded faster, delivering more data earlier, increasing the work demanded from the browser during interactions. Improving LCP could thus degrade INP.
During the third phase, product requirements evolved: users wanted to see 100 rows per page instead of 20 in the Call List. This had a negative impact on LCP and INP, due to the greater number of elements to load.
The standard solution for this type of problem is virtualization, a clever technique that creates only the elements visible on screen rather than all elements needed to display the data. This performance gain also offers another UX benefit: users perceive a consistent response time regardless of data volume. The predictability of page loading times produces a reassuring sense of stability.
For the implementation, we first used the built-in virtualization in PrimeVue, our UI component library. It was a simple solution, but we encountered UX problems: flickering during scrolling, and row expansion, a core feature for displaying transcript search results, was chaotic because the virtualizer couldn't handle dynamic row heights effectively.
We found an alternative solution with TanStack Table. The headless approach meant writing more code, but it gave us total control over the DOM elements. Now, row expansion is perfectly stable and scroll behavior is consistent across browsers. We also observed a slight performance improvement compared to the first solution. This was the only phase where LCP (-67%) and INP (-65%) moved together in the right direction.
The Call Details page has a different usage pattern than the Call List. Opening a call loads:
Like the list view, this page is content-heavy, but the difference is that it is highly dynamic: the audio player requires continuous UI updates to scroll through the conversation.
While our Call List optimizations showed up fairly clearly in Real User Metrics (RUM), the Call Details page was of a different nature. The wide variation in call durations produced data that was difficult to read and interpret.
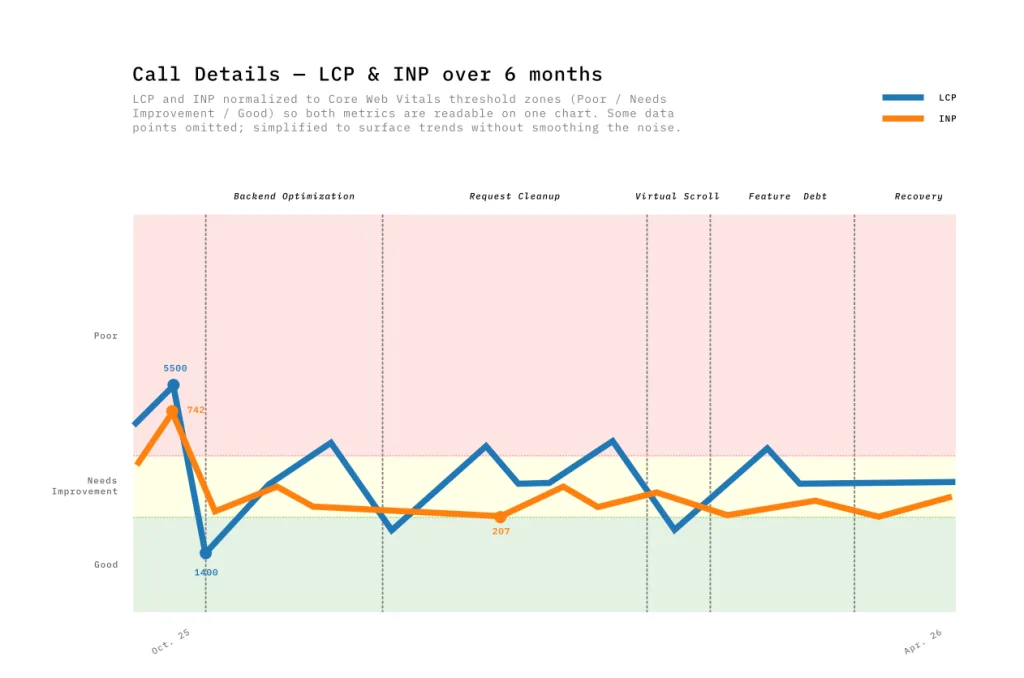 We therefore relied on Lab Data to isolate bottlenecks during development. Using custom Python scripts, we analyzed performance traces and Lighthouse reports from Chrome DevTools to find root causes:
While these optimizations are barely noticeable on modern machines, they prove crucial on more modest devices where main-thread congestion is a bottleneck. Locally, we measured an average gain of 10 frames per second (FPS). This improvement ensures smoother playback.
 Alongside structural architecture changes (like virtualization) that take several weeks, we turned our attention to a major UX lever: the perception of waiting time.
Performance is more than just a technical metric; it is a business argument. By comparing 12-week periods before and after our optimizations, the results were undeniable:
We closely tracked LCP, INP, and TBT, and the improvements were real. But their relevance was confirmed when they converged with user perception.
After virtualizing transcripts and parallelizing API calls, one user summed it up:
"I thought I had changed my hardware. Opening a call used to take forever, now it's under two seconds."
Dashboards quantify progress; user feedback validates its impact. When both move in the same direction, that's where improvement becomes tangible.
Largest Contentful Paint (LCP), web.dev TanStack Virtual, Official Documentation Interaction to Next Paint (INP), web.dev
Behind the tech
Here, we will discuss the monitoring tools used by uh!ive to oversee these services. Monitoring tools not only allow us to stay informed about…
July 23, 2026
Case studiesBehind the tech
1. Introduction 1. Context For years, two 60 TB servers served as the backbone of our storage, replicated over long distances to ensure redundancy.…
January 29, 2026